Illuminance data from lighting simulations comes in a variety of different presentations. The variances are usually in the format that the illuminance data is presented and the view in which it is presented.
Formats of Illuminance Data
Photometric calculations are commonly found in three different formats and are sometimes even presented as several formats combined.
Point by Point Calculations
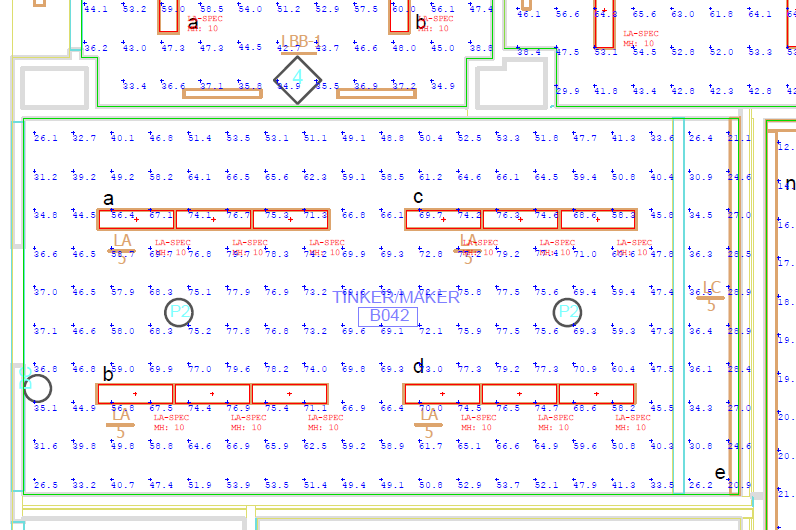
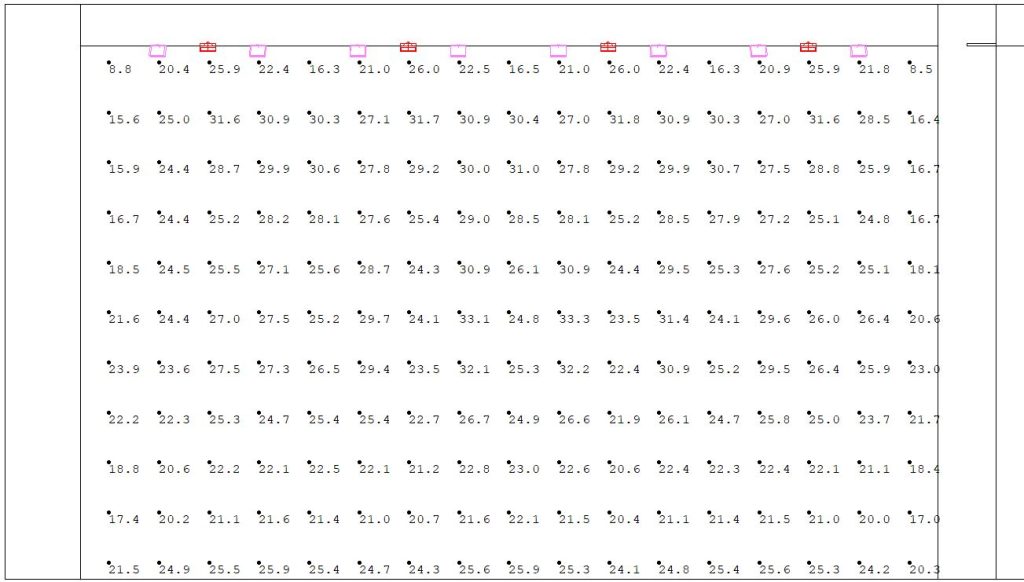
Point by point calculation grids are by far the most typical way that photometric calculations are realized. They offer numerical representations of illuminance that are equally spaced as points within a grid. Illuminance is commonly displayed as foot-candles in the United Stares and lux in other parts of the world.
Horizontal point by point calculations (in AGi32).
Iso Lines
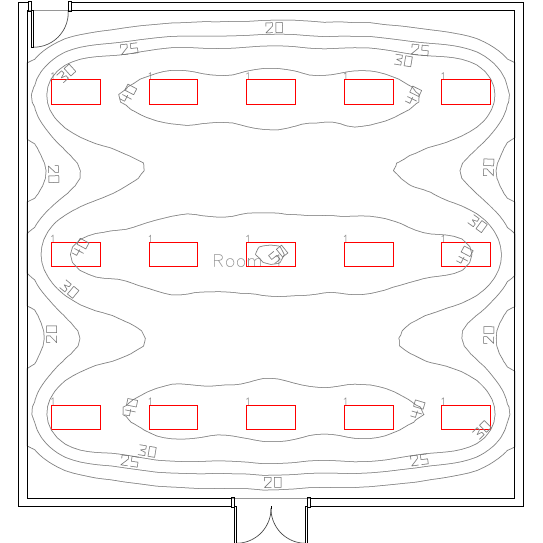
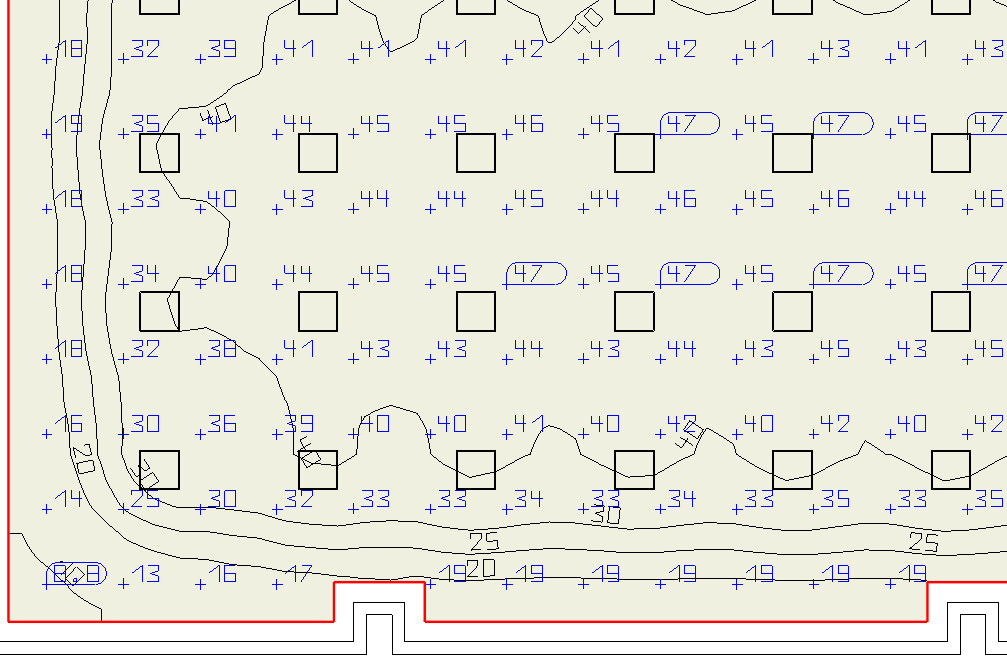
To better visualize outward illuminance levels as distances increase from fixtures, lighting calculations are sometimes also provided using contour lines. Contour lines are often colored, and the illuminance interval at which they are displayed is dependent on maximum and minimum light levels and chosen level of detail.
Isolines calculations (created in DIALux Evo).
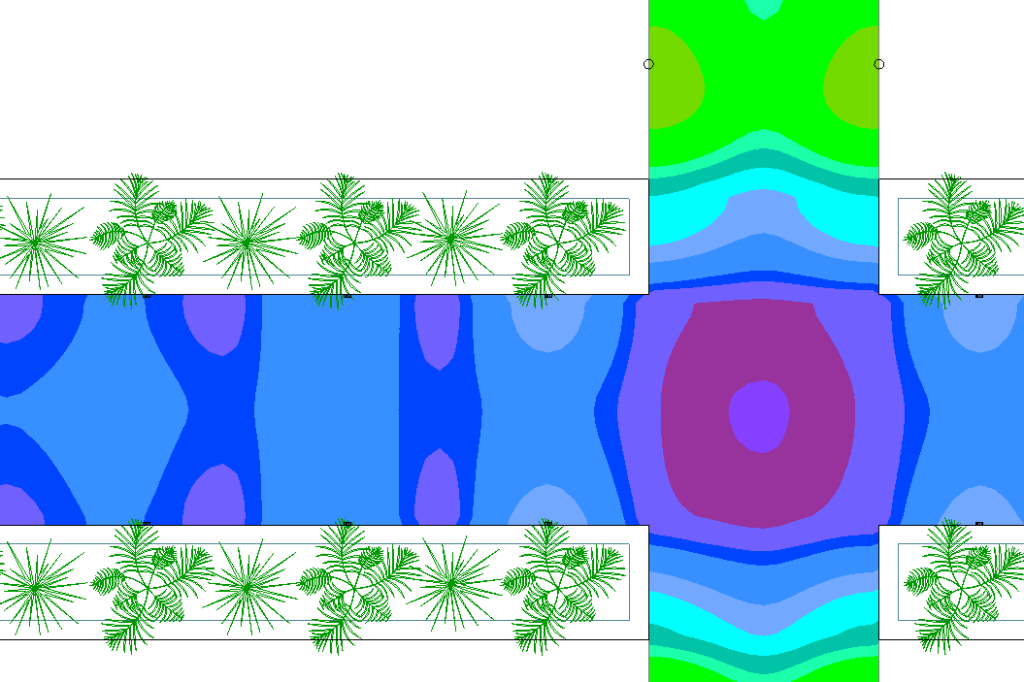
Pseudo color walkway calculations (created in DIALux evo).
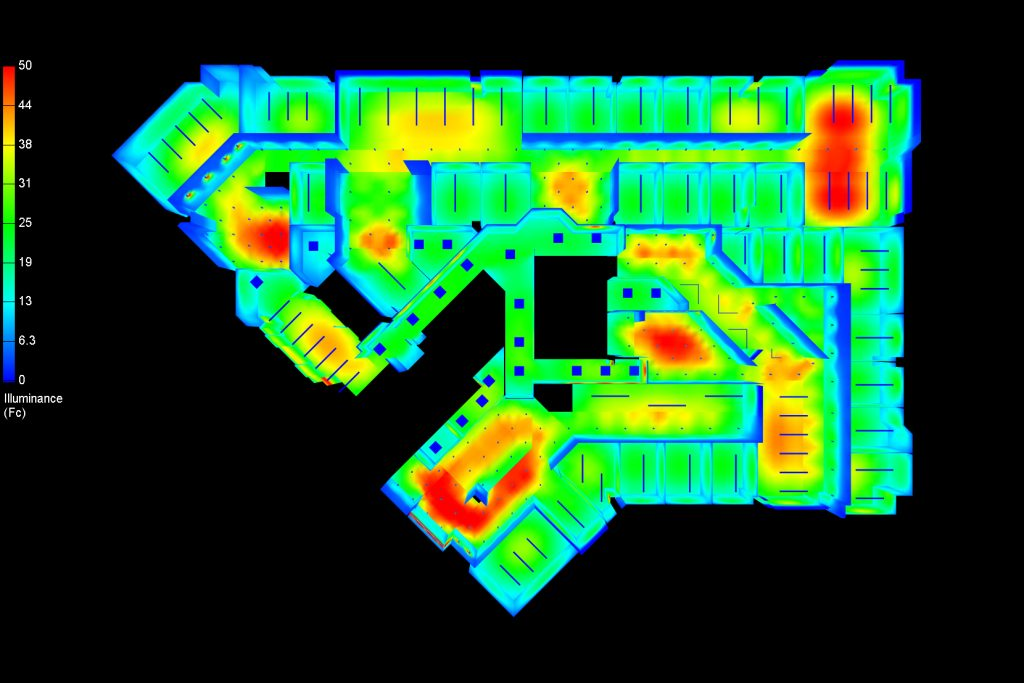
Pseudo Color (False Color)
Pseudo color (also known as “false color”) results assign a range of colors within the maximum and minimum illuminance values, allowing results to be viewed as colors. Pseudo color images offer a strong “first glance” analysis of lighting results. Reports are accompanied by a scale that shows the foot-candle range represented across the color spectrum.
Combinations
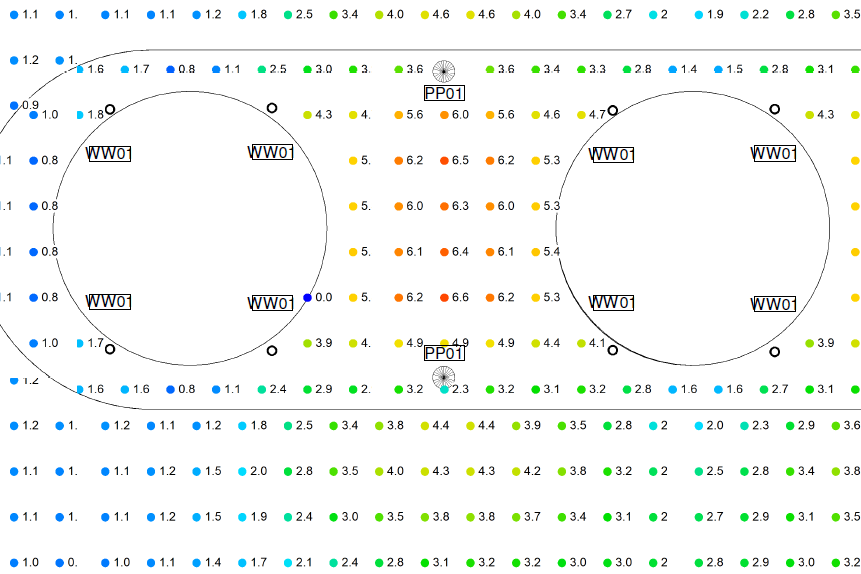
It is not uncommon for calculation results to be provided using a combination of 2D visualization methods. For example, sometimes false colors are assigned to calculation grid values, or calculation grids and contour lines are provided simultaneously within one view.
Point by point calculations with points assigned a pseudo color scale (created in Revit with ElumTools).
Point by point calculations and iso lines featured simutaniously within a report (created in DIALux evo).
Calculation Models and Views
Photometric calculations may be performed on rooms and areas modeled at varying degrees of completeness and complexity. The complexity of the 3D model created depends on the available CAD files and construction documentation from architects and designers, along with a consideration of what architectural features will alter or obstruct light enough to realistically affect calculation results. Results are most often displayed in typical 2D construction plan drawings and sometimes as 3D renderings:
2D View: Horizontal Calculations
The majority of point by point calculations are calculated horizontally along a floor plane, with the deliverable appearing in a floor plan, site plan or reflected ceiling view. While areas such as hallways, gyms, staircases and parking lots display illuminance results at floor plane level, many typical indoor areas such as offices, classrooms, and conference rooms display illuminance results at a defined “workplane” height (typically 2’6″ above the floor).
For many spaces, using a workplane height in an unfurnished room is enough to design an efficient lighting layout. However, more complex models will sometimes display calculations on the surface of 3D models of furniture. Having such “surface” calculations can be beneficial in certain cases, such as when calculating the illuminance of a counter surface that has undercabinet lights mounted above.
2D View: Vertical Calculations
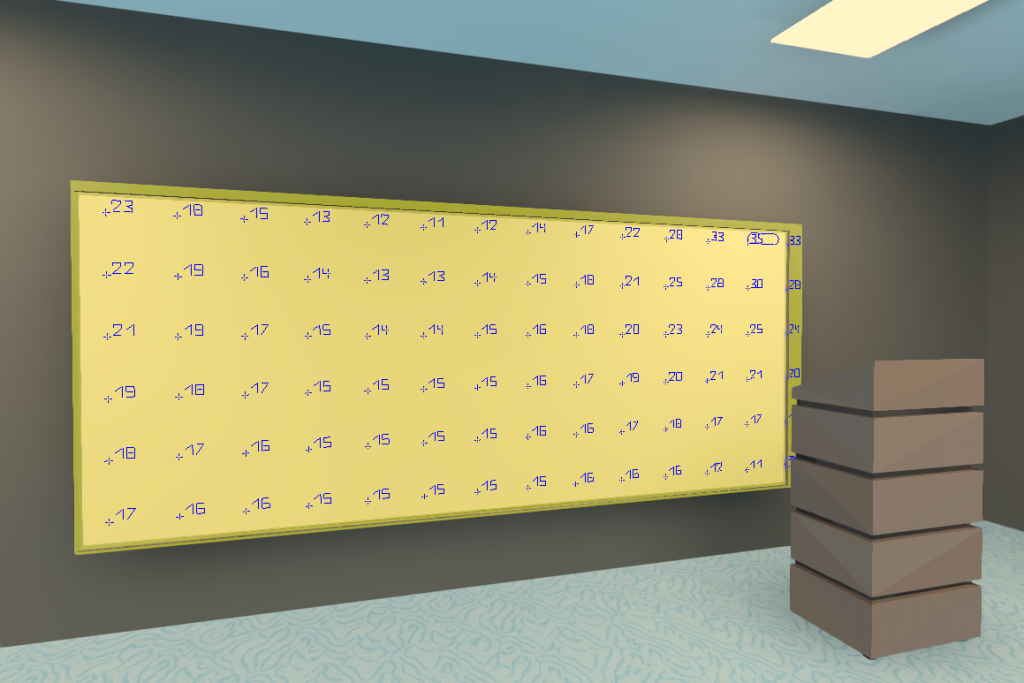
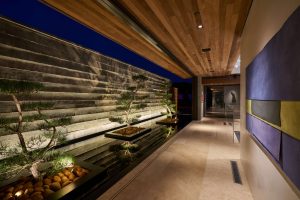
In many lighting design situations, it is desirable to know the illuminance of a vertical surface. Examples include bookshelves, gallery walls, building façades, and signs. In such cases, horizontal results are provided along a vertical plane in a section, elevation, or 3D view.
Point by point calculations on a display wall (realized in Agi32).
3D Renders
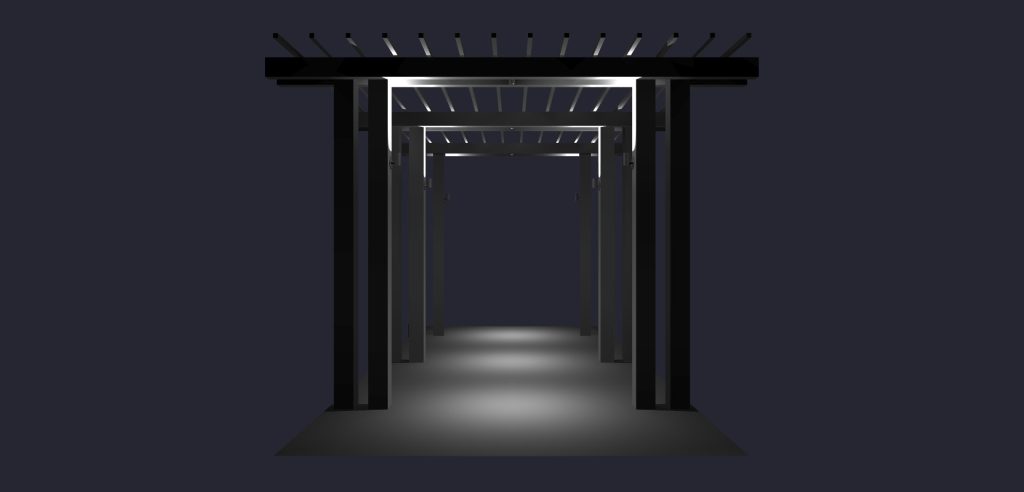
While horizontal and vertical calculations can provide an accurate understanding of project illuminance, such 2D views only go so far for conceptualizing the illuminated area. It is common for photometric studies to also include 3D representations of the space, which accurately depict the distribution of light, reflections and shadows. Sometimes, 3D views also include visible calculation values. Having such 3D views not only allows designers to know the complexity and extent of the 3D model used in the simulation, but also allows them to better visualize how lighting is distributed throughout a project.
A pergola lighting design created using Revit and ElumTools.
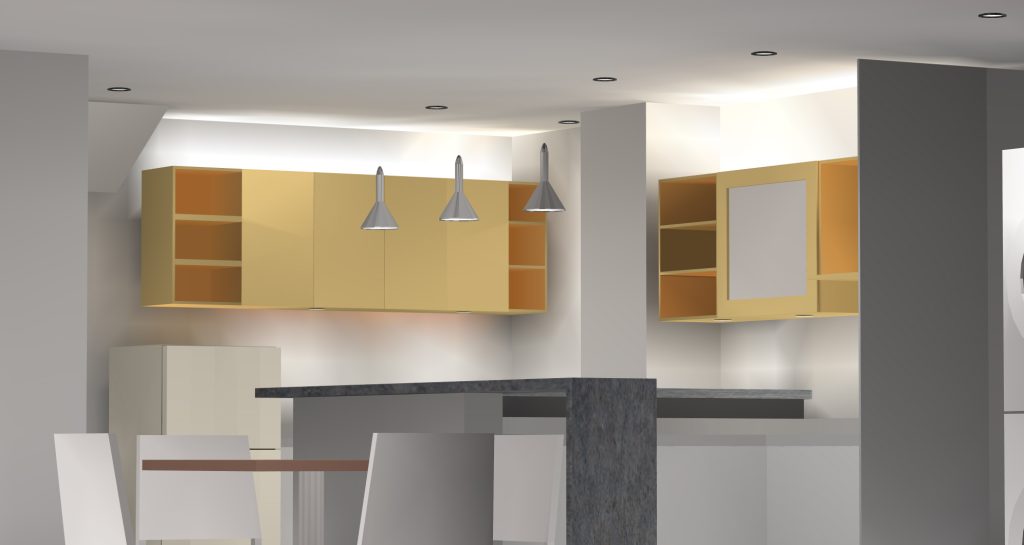
A 3D render of a common-area kitchen created in AGi32.
A 3D render of a classroom with a vertical calc plane on the whiteboard (created in DIALux evo).
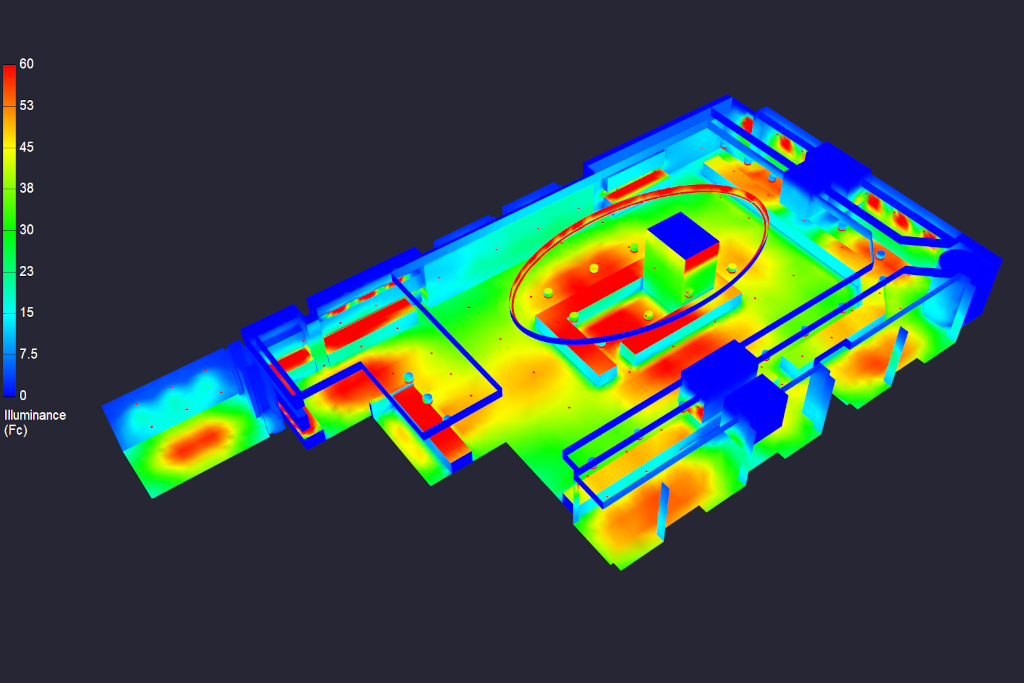
3D pseudo color view of a servery (Created in AGi32).