While all lighting calculation reports vary slightly depending on the software used and the applications engineer running the simulation, they always include the same key elements. The above report contains the calculation essentials and below a breakdown of each element is offered:
Lighting Plan
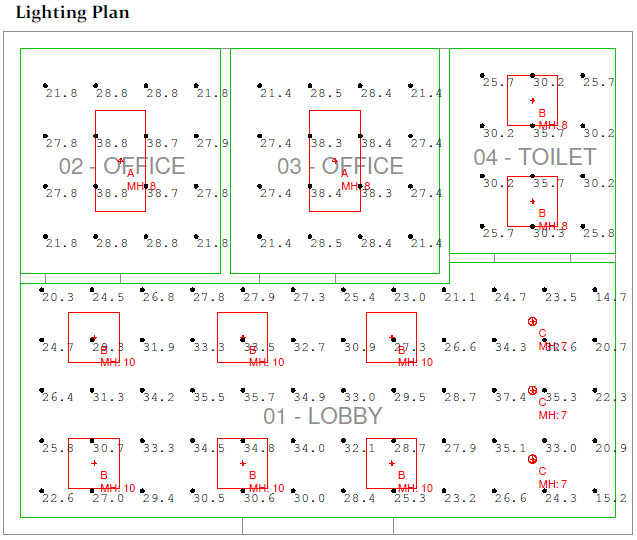
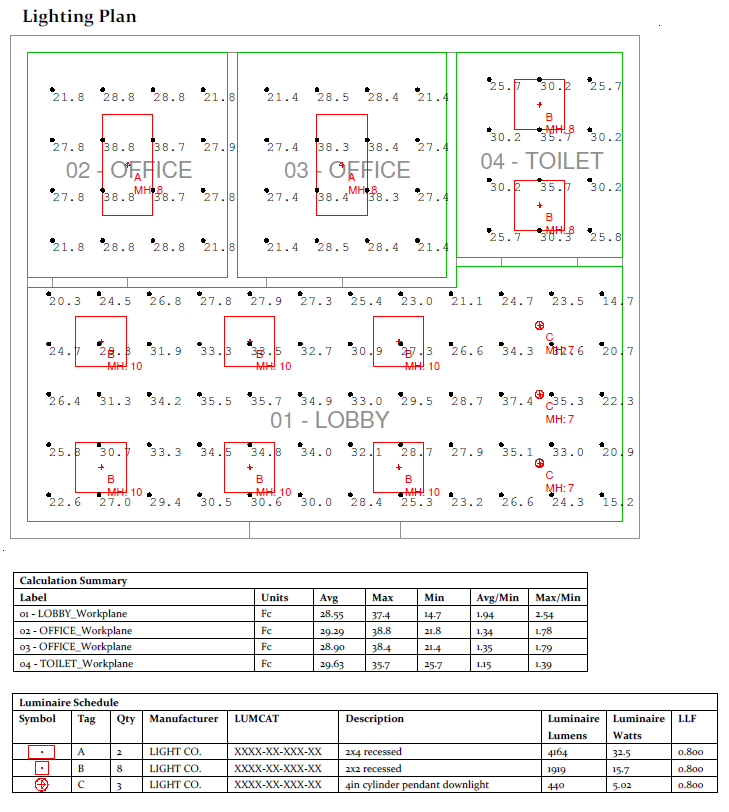
The plan view of horizontal calculations is most typically a floor plan, reflected ceiling plan, or site plan view. it has two chief components:
Luminaires
Luminaires are typically colored to stand out in the drawing and include a “tag” made up of numbers and or letters, which helps identify them on the luminaire schedule. Luminaire mounting height (MH) is also usually included, with the occasional addition of information such as lumen output.
Calculation Grids
Calculation grids are planes made up of equally-spaced points that display calculated illuminance values at each’s respective location. The height of the calc grid is dependent on a space’s intended use. For example, a hallway’s calc points are typically on the floor, while an office or conference room typically has a calc grid elevated at “workplane height,” which is typically 2’ 6” above the floor. (this is about the typical height of desks and tables).
An view of the Lighting Plan. Luminaires appear in red and numerical grids of calc values in black.
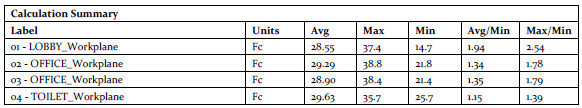
Calculation Summary
A calculation summary provides valuable information on each calculation grid in the model. The usual components are described below:
A view of the Calculation Summary. Each room was assigned it's own calculation grid.
Label
Name of the room or area where the calc grid is located.
Units
It is very common to include the units used. This is especially important in the United States, where sometimes lux is used instead of the regional preference of foot candles.
Average
The average of all values within the calc grid.
Max
The maximum value within the calc grid.
Min
The minimum value within the calc grid.
Avg/Min
The ratio of average foot-candles to the lowest foot-candle calc point for each region. This is a useful measurement of lighting uniformity.
Max/Min
The maximum point of each region divided by the lowest point. This is also a good indicator of lighting uniformity.
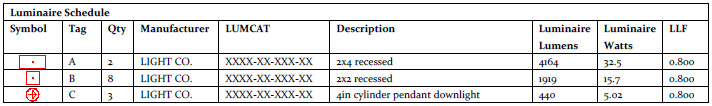
Luminaire Schedule
A luminaire schedule offers details about the luminaires being tested in the simulation. The schedule usually includes:
A view of the Luminaire Schedule.
Symbol
The symbol that represents the luminaire in the drawing.
Tag
A unique numerical and/or alphabetic combination for identifying the luminaire in the drawing.
Qty
A count of the number of luminaire of that type being tested.
Manufacturer
The name of the luminaire manufacturer.
LUMCAT
The model or product number that helps identify the luminaire and its options.
Description
Useful information about the luminaire. This commonly includes its size and the type of light output.
Luminaire Lumens
Calculations always include the lumen output of the luminaire(s). Note that the value displayed is not always Luminaire Lumens, but sometimes is instead Delivered Lumens or Nominal Lumens.
Luminaire Watts
The wattage of the luminaire.
LLF
The Light Loss Factor, or LLF, is a multiplier used to represent the decreasing output of a luminaire overtime due to things such as decreased efficiency and environmental factors. Read more about it here.